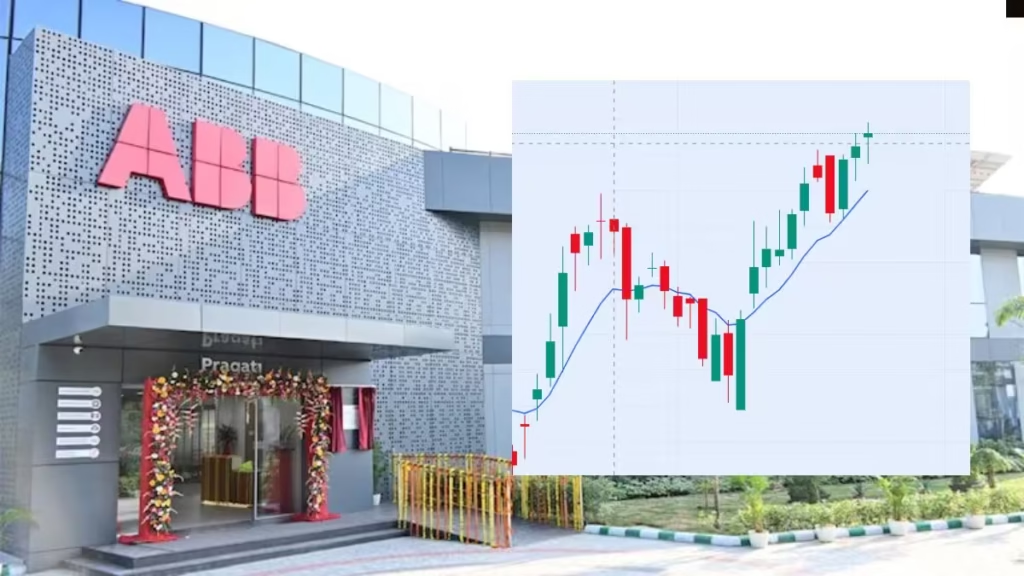
ABB India Ltd is gaining attention once again as it forms a strong bullish pattern on the technical charts. The stock is currently trading at ₹5,961, after rising ₹37 or about 0.62% in the last trading session.
This recent price movement, along with key technical indicators, suggests the stock could be setting up for further gains in the short term.
The Relative Strength Index (RSI) for ABB India stands at 57.29. This level is still below the overbought zone and indicates that there is room for the stock to move higher. A rising RSI in this range is often considered a healthy sign of strengthening momentum.
Read Also: Clean Energy Stock Eyes Fresh Bullish Move After Taking Support at Key Level
In addition, the stock is trading above its 9-day Exponential Moving Average (EMA). This is a commonly used short-term trend indicator, and when the stock holds above this line, it usually means the buyers are staying in control.
These technical factors together are seen as signals of a possible bullish phase continuing in the near future.
According to market analysts, ABB India has the potential to reach above ₹6,584 in the short term if the current momentum holds. With positive technical signals and steady price movement, traders are now keeping a close watch on the stock.
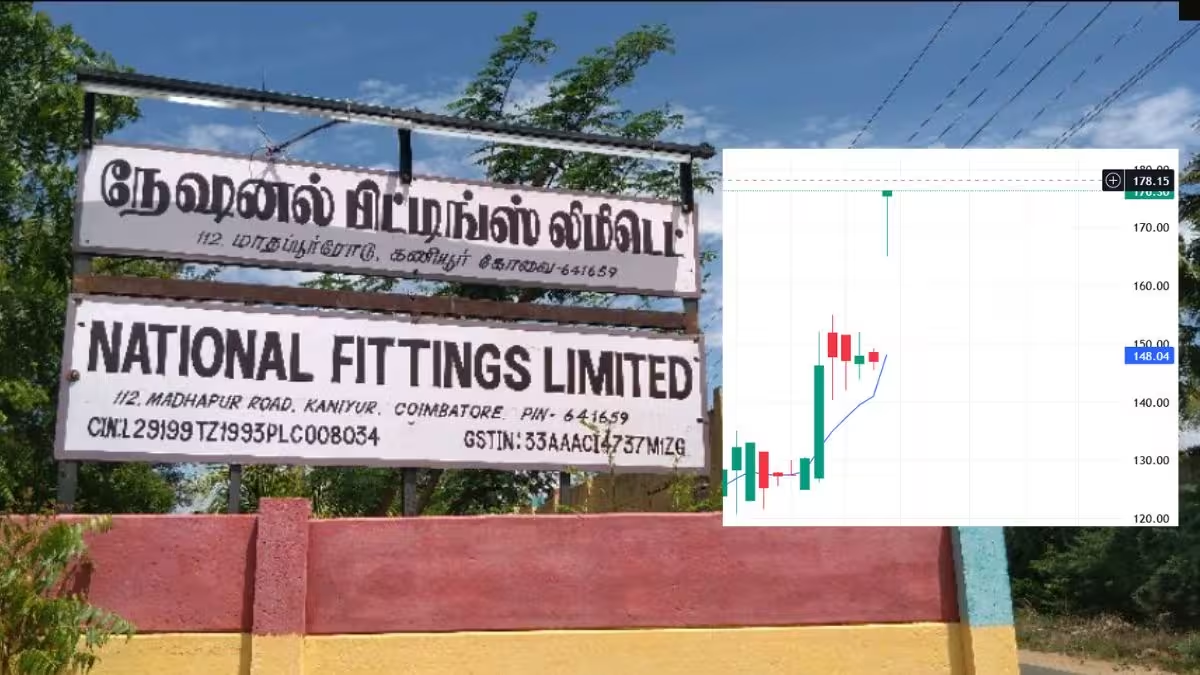
Read Also: National Fittings Breaks Out After Year-Long Range With Big Jump in Volume
The recent upward move was not very large, but it came with strong support at key levels, which adds to the strength of the trend. A breakout above the next resistance could push the stock even higher.
ABB India is known for its steady business fundamentals and consistent investor interest. The recent pattern in the chart shows that after a period of healthy consolidation, the stock is slowly regaining momentum.
Traders believe that this kind of setup — where the stock holds support and builds gradually — can often lead to a sharp rally, especially when confirmed by volume and indicators like RSI.
Read More: DMART Shows Early Signs of Recovery After Recent Correction
Investors should keep an eye on the ₹6,000 level in the next few sessions. A strong close above this mark, along with rising volume, would further confirm the bullish trend.
As long as the stock stays above the 9-day EMA and RSI continues to rise gradually, the outlook remains positive. Traders may also look at ₹6,200 as a near-term resistance before aiming for ₹6,584 and above.
Read Also: Big Move Coming: MRF Continues Strong Rally with More Upside Expected